Co-author
M. Rybansky (1), M. Sobotka (2), M. Lorenc (1), M. Barandas (3), J. M. Fonseca (3); 1 - Slovak Central Observatory, Komárňanská 134, SK-94701 Hurbanovo, Slovak Republic; 2 - Astronomical Institute, ASCR, Fricova 298, 251 65 Ondřejov, Czech Republic; 3 - CTS-UNINOVA/CA3, Campus FCT/UNL, Caparica, Portugal
Affiliation
Slovak Central Observatory, Komarnanska 134, SK-94701 Hurbanovo, Slovak Republic / CTS-UNINOVA/CA3,
Main category
Natural Sciences (Astrophysics and Astrononmy)
Abstract
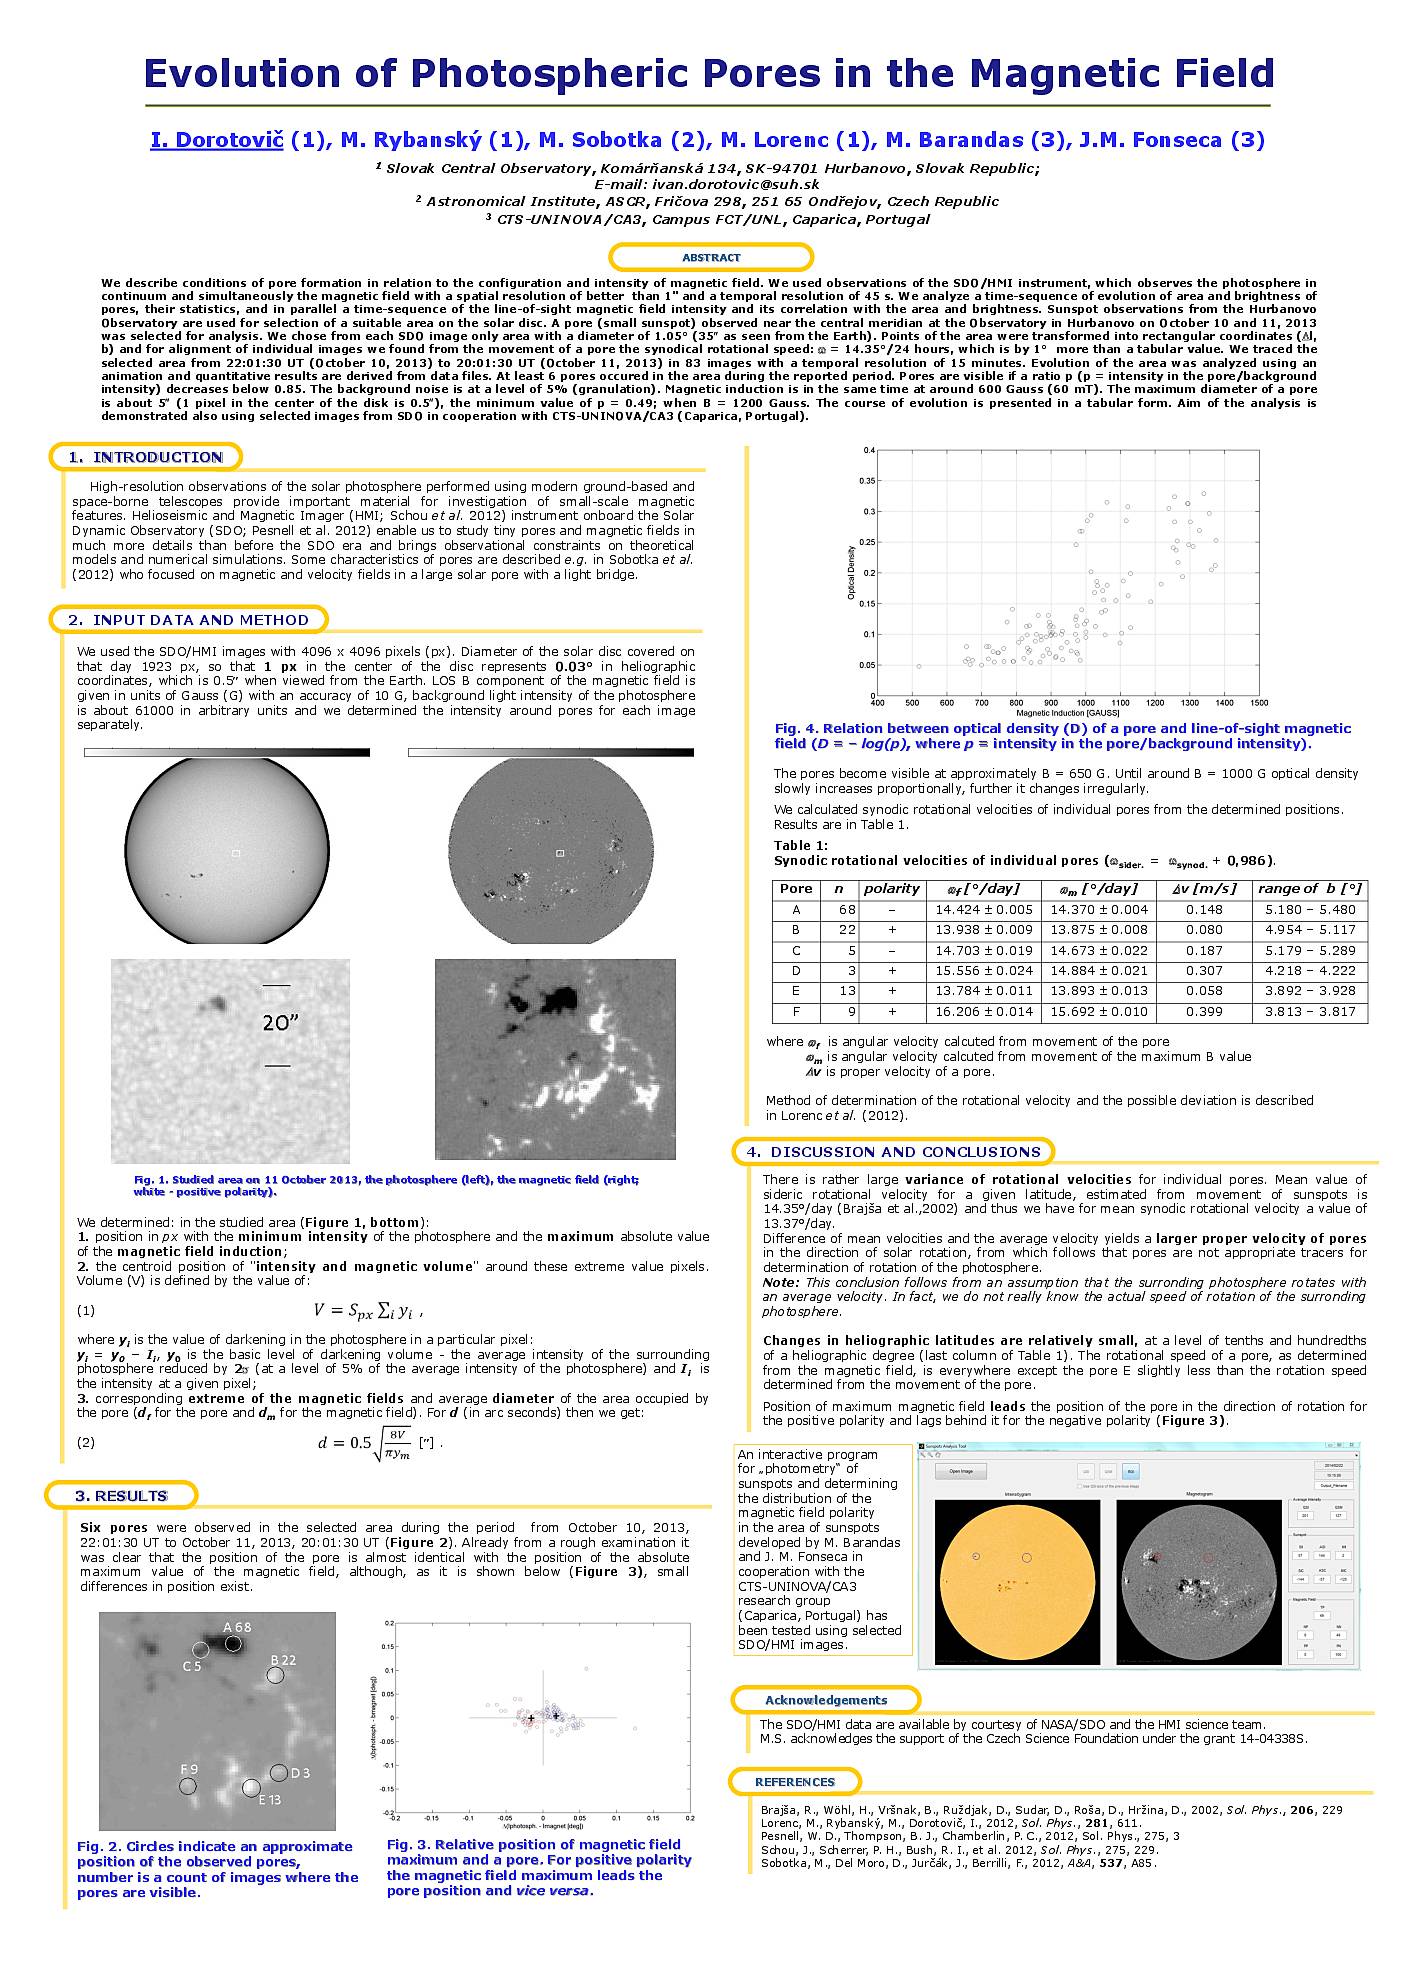
We describe conditions of pore formation in relation to the configuration and intensity of magnetic field. We used observations of the SDO/HMI instrument, which observes the photosphere in continuum and simultaneously the magnetic field with a spatial resolution of better than 1′′1′′ and a temporal resolution of 45 s. We analyze a time-sequence of evolution of area and brightness of pores, their statistics, and in parallel a time-sequence of the line-of-sight magnetic field intensity and its correlation with the area and brightness. Sunspot observations from the Hurbanovo Observatory are used for selection of a suitable area on the solar disc. A pore (small sunspot) observed near the central meridian at the Observatory in Hurbanovo on October 10 and 11, 2013 was selected for analysis. We chose from each SDO image only area with a diameter of 1.05∘1.05∘ (35′′35′′ as seen from the Earth). Points of the area were transformed into rectangular coordinates (ΔΔl, b) and for alignment of individual images we found from the movement of a pore the synodical rotational speed: ωω = 14.35∘14.35∘/24 hours, which is by 1∘1∘ more than a tabular value. We traced the selected area from 22:01:30 UT (October 10, 2013) to 20:01:30 UT (October 11, 2013) in 83 images with a temporal resolution of 15 minutes. Evolution of the area was analyzed using an animation and quantitative results are derived from data files. At least 6 pores occured in the area during the reported period. Pores are visible if a ratio p (p = intensity in the pore/background intensity) decreases below 0.85. The background noise is at a level of 5% (granulation). Magnetic induction is in the same time at around 600 Gauss (60 mT). The maximum diameter of a pore is about 5′′5′′ (1 pixel in the center of the disk is 0.5′′0.5′′), the minimum value of p = 0.49; when B = 1200 Gauss. The course of evolution is presented in a tabular form. Aim of the analysis is demonstrated also using selected images from SDO in cooperation with CTS-UNINOVA/CA3 (Caparica, Portugal).
Do you have problems viewing the pdf-file? Download poster
here
If the poster contains inappropriate content, please
report the poster. You will be redirected to the landing page.