Affiliation
E. Hartig , University of Vienna, Department of Astrophysics
Main category
Natural Sciences (Astrophysics and Astrononmy)
Abstract
The NASA Kepler K2 mission offers new opportunities to search for long period variables (LPVs) along the ecliptic plane.
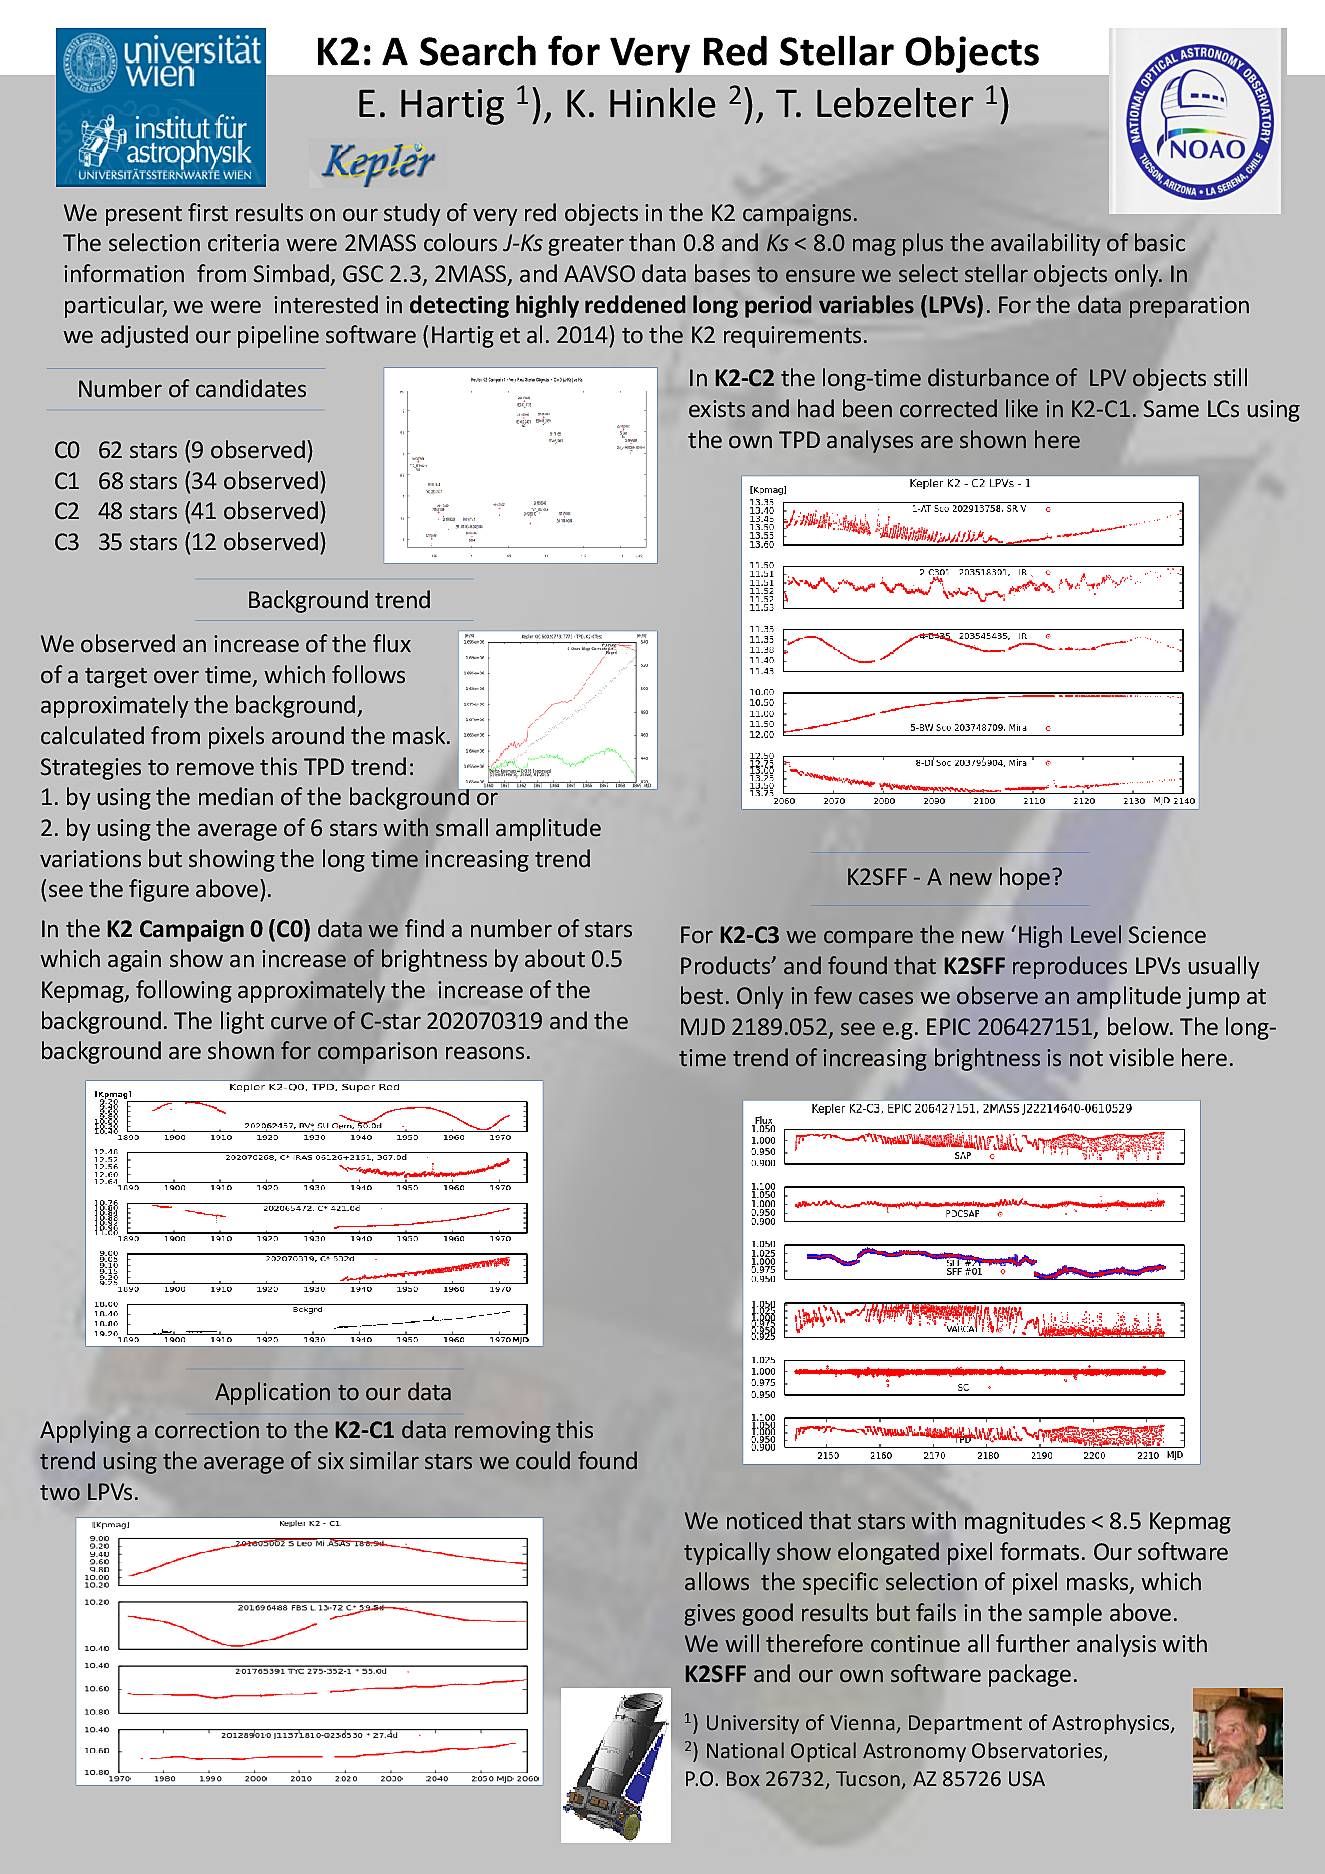
We present first results of our observing proposals for ‘Super-Red-Targets’ in the Kepler K2 Campaigns 0 to 3 (GO0083, GO1003, GO2089, GO3089). The proposal aims at finding and characterizing very red variable objects in the Kepler K2 fields. Selection criteria were 2MASS colours J-Ks greater than 0.8 and Ks less than 8.0 mag plus the availability of some basic information from Simbad, GSC 2.3, 2MASS, and AAVSO data bases to ensure that we select stellar objects only. A main group of stars found with these selection criteria are long period variables (LPV). To focus on these objects we set a lower period limit of 10 days. The usability of K2 for this search is limited since the observation period of an individual target is limited to 80 days. However, this time scale allows detecting LPVs and making an estimate of the period length. Even more than for the Kepler primary mission (see Hartig et al., 2014) the data reduction had to be done with care to extract the true stellar signal. This data reduction is discussed in this poster.
For the data preparation we adjusted our pipeline software for TPD, which we used in the Kepler primary mission and modified it to the K2 requirements. While the 6 hours signal caused by the firing of the thrusters for correcting the telescope’s pointing could be easily corrected, a non-linear flux increase over each observation period had to be removed up to campaign C2. This had to be done very carefully since any long time instrumental signal would interfere with a possible long period signal of the star. Furthermore, it turned out that stars with magnitudes < 8.5 Kepmag typically show elongated pixel formats. This has been handled by an appropriate pixel aperture, and so we could improve the light curve’s signal to noise ratio significantly. Some examples are shown.
Finally, we compare our results of Campaign 3 with the officially supplied light curves, e.g. Armstrong, et al., 2016, and present our first preliminary results here.
Ref.:
Armstrong, D. J., Kirk, J., Lam, K. W. F., et al., 2016, MNRAS, 456, 2260
Hartig, E., Cash, J., Hinkle, K. H., et al., 2014, AJ, 148, 123
Do you have problems viewing the pdf-file? Download poster
here
If the poster contains inappropriate content, please
report the poster. You will be redirected to the landing page.